1) it was working and I’m a strong advocate of the old saying “If it’s not broke, don’t fix it”
2) the system allowed me to have 4 nics installed
3) the money that I could use to upgrade the system could be better spent elsewhere (like on my other systems)
The PFSense system that I have ran for years was starting to meet it’s end. The system hardware started to fail and the system would randomly reboot throughout the day which made accessing the Internet challenging so I guess it was time for me to invest in a new system. Originally I thought I would get one of those fanless embedded PFsense devices that start at $199 with only two NICs to replace my old system until a friend at work hip me to using an WatchGuard appliance that could be bought on ebay any where from $25 - $80 with 8+ network connections. HEY!!! -- I’m all about saving $$ like the next guy and I find a WatchGuard x700 on ebay that had the “Buy Now” option for $59 and free shipping and place the order for the new appliance that would replace my current PFSense system.
I decided to document the steps and any lesson learned from my experience of installing PFSense on my newly acquired WatchGuard appliance. I hope this experience may be helpful to someone else that may be looking for an alternative to an old workstation or a fanless appliance.
Installing PFSense 2.0 on a WatchGuard x700 Appliance.
If you do a Google search of PFSense and WatchGuard, you will get thousand of hits related to the query. There are a few good sites out there that you can use when installing PFSense on a WatchGuard appliance such as the PFSense forums and I must credit the URL at the bottom of this post for actually having the information I required to successfully install PFSense 2.0 on my WatchGuard x700 appliance.
I guess it’s best to list the items you will need while installing PFSense to your WatchGuard appliance. There nothing like having to run to the store to buy something that is needed such as a larger CF Card while in the middle of your PFSense install project. Good thing Walmart is open 24 hours :)
Item List:
1. WatchGuard Appliance
2. CF Card Reader/Writer
3. CF Memory Card 2 to 4 Gigs (recommend 4 GB)
4. Serial Cable
5. PFSense nano image (PFSense Site)
6. Miscellaneous files to upgrade BIOS and post PFSense configuration (see below)
Step 1 -- Remove the CF Card
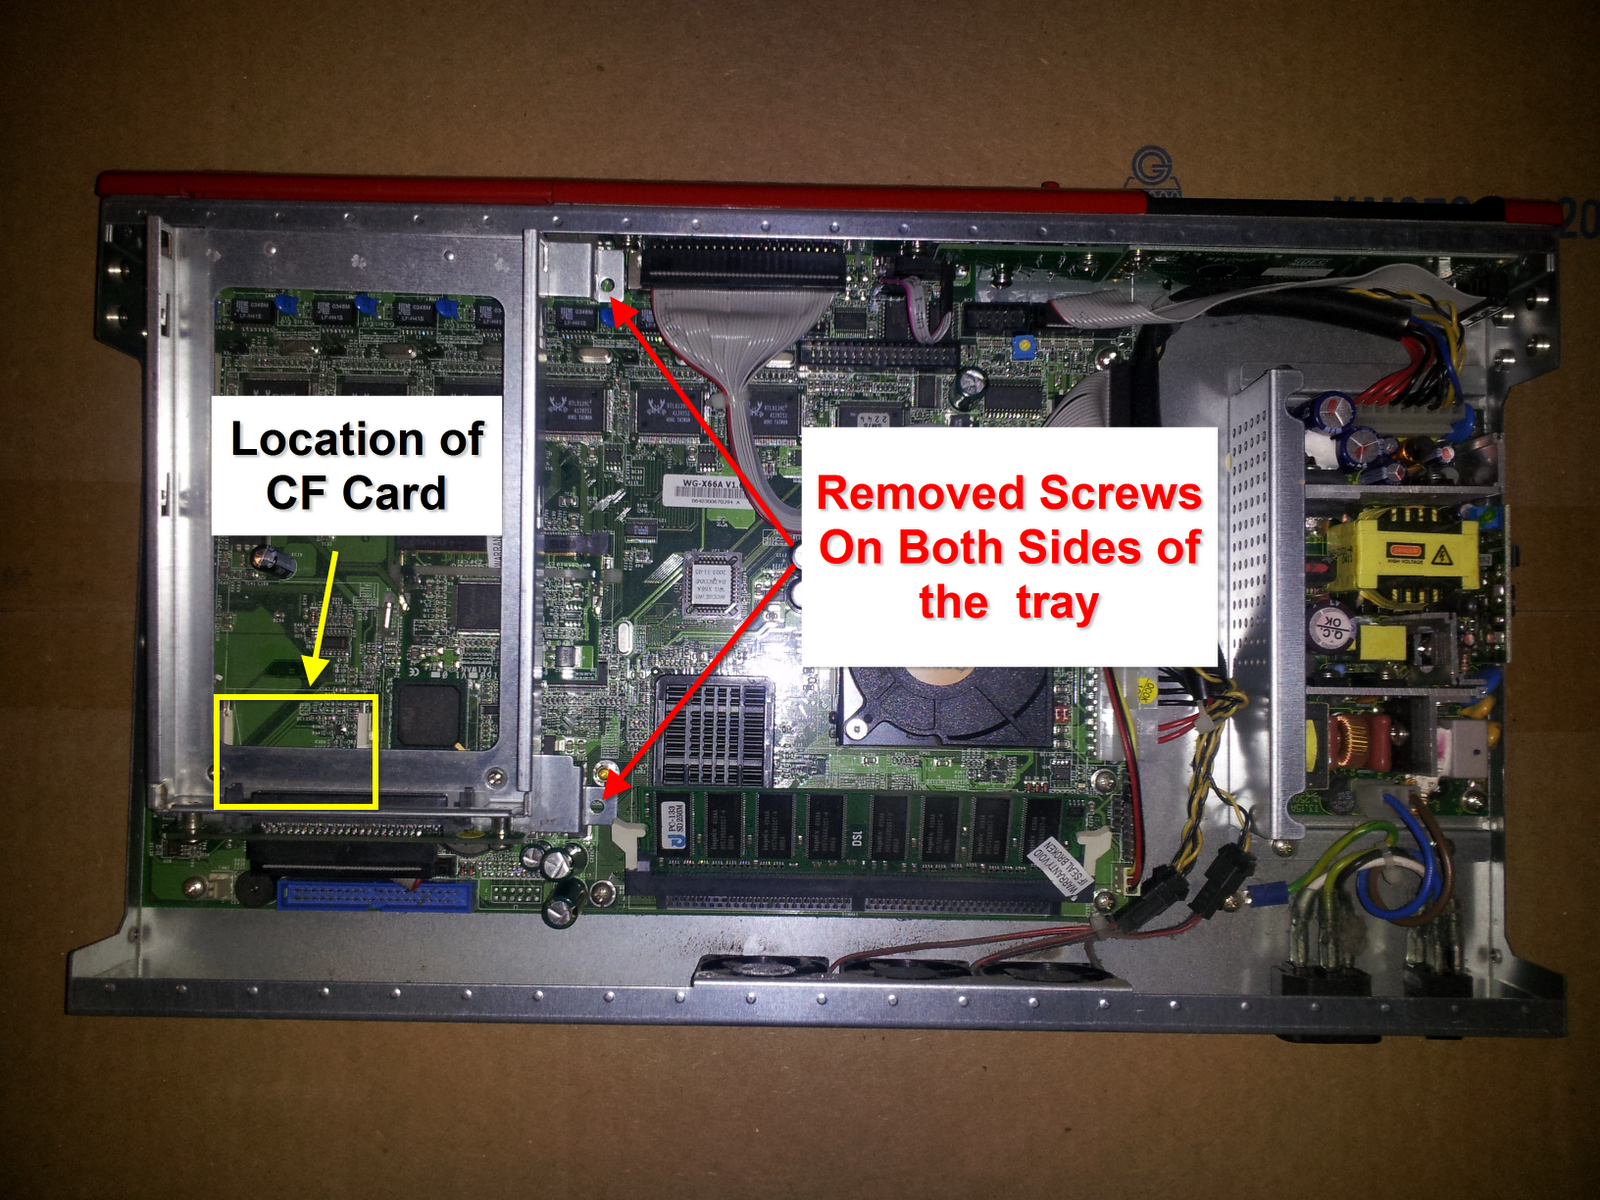
To access the CF memory card, I had to take out the hard drive tray which I was able to simply pull out of the appliance via the front hard drive access panel and remove the screw to the cover.
Below is a picture of how the inside of my WatchGuard appliance looked after the cover was remove and also the CF Memory Card. Sorry, it wasn’t until I was already into performing my upgrade that I decide to document my experience. In the picture I have highlighted where the CF Memory card would be located. I also pointed out the location of the screws to remove the hard drive tray for easier access to the CF memory card. There were four screws that I had to remove from the hard drive tray holder, two on each side.
After successfully removing the 64MB CF Card from the WatchGuard, I was able to finally use an accessory that I have bought years ago and hardly ever used....my Digital Concepts 51 in 1 card reader/writer :)
.jpg)
If you don’t have one, don’t worry. You can pick up one for fairly cheap at one of the following locations:
You don't need a 51 in 1 card just a 1 in 1 that will read and write to your CF Memory Card.
Step 2 - Backup the WatchGuard Firebox CF Image (Optional)
Note: The next steps were all done using a linux system.
Just incase for some strange reason you want to go back to using the factory software that came with the firewall, you can backup the CF Memory card. After connecting the card reader to your computer and inserting the CF Memory Card into the reader, open a terminal window to identify the CF Card connection.
Type: “sudo fdisk -l”
(This will list all drives connected to your system. Look for the disk that is the size of your CF Card. Mines was 64 MB and the output of the fdisk command on my system is listed below:
sudo fdisk -l
Disk /dev/sdd: 64 MB, 64225280 bytes
1 heads, 62 sectors/track, 2023 cylinders
Units = cylinders of 62 * 512 = 31744 bytes
Sector size (logical/physical): 512 bytes / 512 bytes
I/O size (minimum/optimal): 512 bytes / 512 bytes
Disk identifier: 0x00000000
Device Boot Start End Blocks Id System
/dev/sdd1 34 302 8320 83 Linux
Partition 1 does not end on cylinder boundary.
/dev/sdd2 302 1128 25600 83 Linux
Partition 2 does not end on cylinder boundary.
/dev/sdd3 1128 1954 25600 83 Linux
Partition 3 does not end on cylinder boundary.
/dev/sdd4 1954 1987 1024 83 Linux
Partition 4 does not end on cylinder boundary.
According to the output of the fdisk command, the card was located at “/dev/sdd” which contained 4 partitions listed as /dev/ssd1-4.
Now that I have confirmed the device location of the CF memory card “/dev/ssd” I’m now ready to make a backup of the card. Using the “dd” command I created a backup to file
Command Syntax: sudo dd if=/disk device location of=/location and name to save backup image
Command used: “sudo dd if=/dev/sdd of=WatchGuardBackup.img”
Note: of=WatchGuardBackup.img will save the backup image to a file called WatchGuardBackup.img in the current location of the terminal window.
Step 3 - Flash the BIOS of the WatchGuard Appliance
Note: The next steps were all completed using a Linux system.
The next step in getting PFSense to run on a WatchGuard appliance is to flash the BIOS to enable support for larger CF Memory Cards. The WatchGuard appliance currently will not boot from a CF card larger than 256MB and by flashing the BIOS with the X750EB6.BIN file, your WatchGuard appliance will now be able to support CF Memory Cards larger then 256MB.
1. Download the FreeDOSBios.img and X750EB2.BIN BIOS image
2. Write FreeDOSBios.img image to CF Memory Card.
Using the location identified in “Step 2 - Backup the WatchGuard Firebox CF Image” I proceeded to write the FreeDOSBios.img to the CF Memory card. From the terminal window, I ran the following command:
Command Syntax: sudo dd if=/path to FreeDOSBios.img/ of=/disk device location/
Command used: “sudo dd if=/Download/FreeDOSBios.img of=/dev/sdd”
3. After writing the FreeDOSBios.img to your CF Memory Card, mount the CF memory card and copy the X750EB2.BIN file to the bios folder on the CF Card. After the file has successfully been copy to the “bios” folder, you can unmount the CF Card and install it back into the WatchGuard Appliance.
4. Connect your serial cable from your computer to the WatchGuard appliance. Once again, I get to use something that’s has been sitting in a box in my closet for years, my USB to Serial converter. With more than 10+ computers in my household, not one besides my old IBM PFSense system has a serial port. I believe serial ports are a things of the past. When I take my current PFSense system apart I have to make sure I save the serial card. I will place in the box next to the 5 ¼ and 3 ½ disk I have. You never know when you may need some ancient technology in the future LOL.
.jpg)
Note: If you too also do not have a computer with a serial port, you can get a USB to Serial adapter from one of the following sites:
After connecting your serial cable to your computer and the WatchGuard appliance, you want to start a terminal session on the serial cable. To ensure what device your serial cable is using on your system you can check the dmesg log.
In a terminal window type the "dmesg" command. This should display the dmesg log file.
Below is a copy of the tail of my dmesg log file:
[ 2960.116026] usb 5-2: reset full speed USB device using uhci_hcd and address 3
[ 2960.236021] usb 5-2: device descriptor read/64, error -71
[ 2960.460021] usb 5-2: device descriptor read/64, error -71
[ 2960.676021] usb 5-2: reset full speed USB device using uhci_hcd and address 3
[ 2962.112029] usb 5-2: reset full speed USB device using uhci_hcd and address 3
[ 2962.232020] usb 5-2: device descriptor read/64, error -71
[ 2962.456014] usb 5-2: device descriptor read/64, error -71
[ 2962.672021] usb 5-2: reset full speed USB device using uhci_hcd and address 3
[ 3990.232024] usb 5-1: new full speed USB device using uhci_hcd and address 4
[ 3990.505878] usbcore: registered new interface driver usbserial
[ 3990.505889] USB Serial support registered for generic
[ 3990.505915] usbcore: registered new interface driver usbserial_generic
[ 3990.505917] usbserial: USB Serial Driver core
[ 3990.514510] USB Serial support registered for pl2303
[ 3990.514532] pl2303 5-1:1.0: pl2303 converter detected
[ 3990.525896] usb 5-1: pl2303 converter now attached to ttyUSB0
[ 3990.525916] usbcore: registered new interface driver pl2303
[ 3990.525919] pl2303: Prolific PL2303 USB to serial adaptor driver
On my system my the serial cable is using ttyUSB0. If you are unsure which device your serial cable may be using, disconnect the cable from your system view the dmesg log again to see if your can identify the cable being disconnected and then connect it back to your computer again while reviewing the dmesg log again.
Once you know what device your serial cable is using, open a session to your serial cable by using the "screen" command. Typing the following command then turn on the WatchGuard appliance:
Command syntax: screen /dev/{your serial cable device} 9600
Command used: “screen /dev/ttyUSB 9600”
Once you enter the "screen" command in the terminal window, your window will go blank until the WatchGuard appliance fully loaded. My appliance sounded 3 beeps when device had finished booting up and I was presented with the following:
Freedos on COM1:
Current date is Mon 11-05-2012
Current time is 3:44:40.80 am
C:\>
Once you are presented with the “C:\>” prompt, you are now ready to flash the BIOS with X750EB6.BIN file.
C:\>cd bios
C:\BIOS>awdflash.exe X750EB6.BIN /py /sn /cc /e
Lesson Learned Time: Being a person very comfortable with using command line, there were some command line features unavailable in the "screen" terminal session to the serial console. Two such features that have caused me to restart this step many times was the missing tab to autocomplete your commands feature and the inability to use the backspace key. Neither was available while using the "screen" command to access the serial cable. Trying both features sent unrecognizable characters to the terminal window which made my session unresponsive. I was able to regain responsivness after shutdown the WatchGuard appliance.
After you have successfully flashed the BIOS, you can power off the WatchGuard appliance and remove the CF card.
Step 4 -- Installing PFSense on your CF Memory Card
Now it’s time to install PFSense on your CF memory card.
1. Download the PFSense nanobsd Image image for the size of your CF memory card. I downloaded the pfSense-2.0.1-RELEASE-4g-i386-nanobsd.img.gz to install on my 4 GB card.
2. Decompress the .gz file via the "tar" command:
Command Used: tar -xvf ./pfSense-2.0.1-RELEASE-4g-i386-nanobsd.img.gz
3. Write the PFSense image to your CF Memory card. Connect your CF memory card to your card writer and identify the disk device as previously done in “Step 2 - Backup the WatchGuard Firebox CF Image”. Write the PFSense image you downloaded and decompressed to the CF Memory card by using the following "dd" command:
Command Syntax: dd if=/{path to PFSense image} of=/dev/{disk device} bs=16k
Command used: sudo dd if=./pfSense-2.0.1-RELEASE-4g-i386-nanobsd.img of=/dev/sdd bs=16k
4. Install CF Memory Card with PFSense installed in the WatchGuard appliance and open a session with your serial cable as you did previously using the "screen" command:
Command Syntax: screen /dev/{your serial cable device} 9600
5. Power on your WatchGuard Appliance and this time you should be presented with the PFSense initial setup Wizard.
From this point on you would set up PFSense just like a regular installation.
See How to Install PFSense and How to Configure PFSense.
I want to thank the following sites with helping me to successfully install PFSense on my Watchguard appliance.
http://www.nettechonline.net/index.php/pfsense/pfsense-watchguard/78-x700-led-fix-pfsense-on-watchguard.html?catid=49%3Apfsense-watchguard
http://www.nettechonline.net/index.php/pfsense/75-x700-a-pfsense-20-rc1.html?catid=49%3Apfsense-watchguard
http://practicalkungfu.net/2012/02/20/how-to-install-pfsense-2-0-on-a-watchguard-x750e-core/


